University of Technology Sydney: student application flow analytics

The UTS student portal is used by future postgraduate, higher degree research, and undergraduate honours students to apply to study at the university. This portal, which is a crucial entry point for prospective students, has been broadly recognized as suffering from wide-ranging usability issues. Due to these concerns, I was tasked with the important responsibility of confirming the extent of these problems with concrete evidence.

To achieve this, I planned to examine the analytics as part of the process of collecting evidence of usability issues. By analysing the data, I aimed to identify patterns and specific areas where students encounter difficulties. This step is essential for understanding the user experience and pinpointing the aspects of the portal that need improvement. Gathering this evidence will help inform our strategies for enhancing the portal’s usability, ensuring it better meets the needs of the students and improves their application experience.

I sought to examine the analytics as part of the process of collecting evidence of usability issues with the UTS student portal. By analysing the data, I aimed to identify patterns and specific areas where students encounter difficulties. This step is crucial for understanding the user experience and pinpointing the aspects of the portal that need improvement. Gathering this evidence will help inform our strategies for enhancing the portal’s usability, ensuring it better meets the needs of the students.

I reached out to the analytics subject matter expert to gain access to Google Analytics. After explaining the goal and its importance to our project, they agreed to provide the necessary assistance. Their cooperation ensures that we can move forward with the data and insights we need to achieve our objectives.

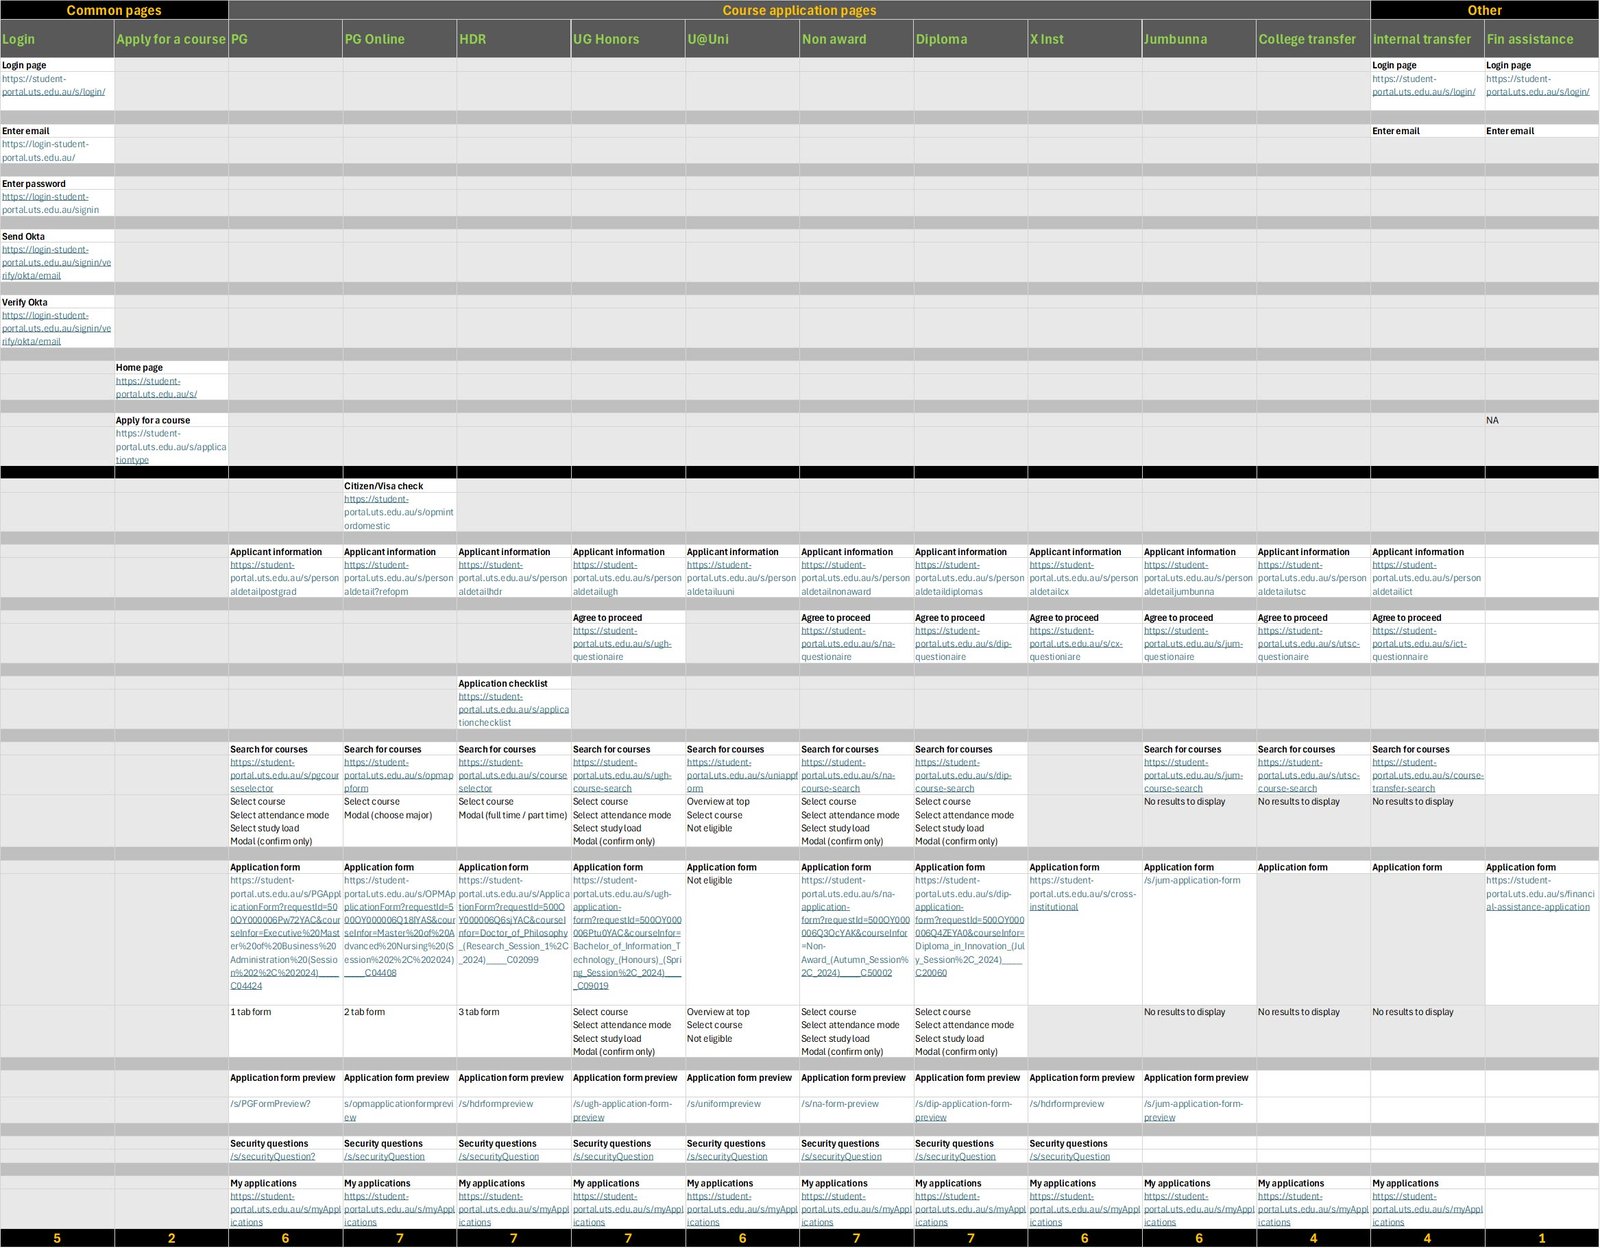
The first step involved mapping the pages a user visits in order to complete each of the 11 application forms. I provided the analyst with both the page name and the link in the structure below.

Application flows

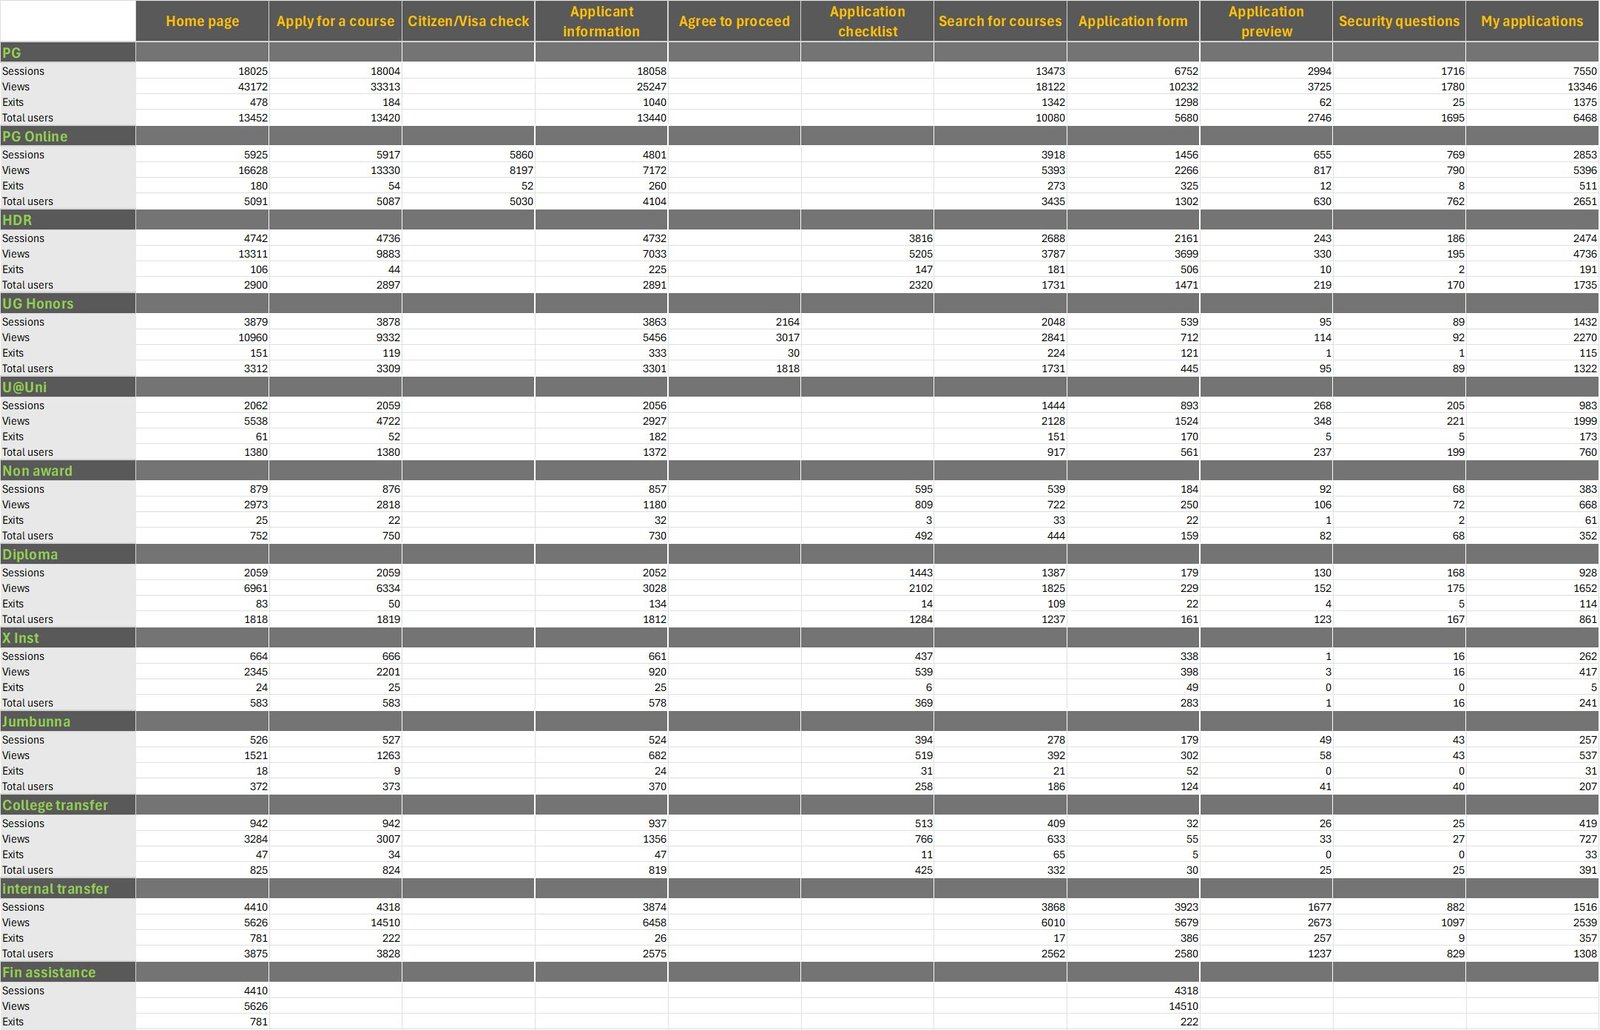
The analytics were returned from the analyst within a list of approximately 1000 other pages.

The analytics were listed in four categories:

  1. Sessions: The total number of visits to the portal
  2. Users: The number of unique individuals accessing the portal
  3. Exits: The points at which users leave the portal
  4. Total Users: The cumulative number of users over a specified period

By examining the metrics on each category, we can gain insights into:

  • Sessions: Understanding the overall usage and identifying trends in user activity.
  • Users: Providing a sense of how many potential applicants are engaging with the system.
  • Exits: Highlighting potential problem areas where users might be encountering difficulties or frustrations.
  • Total Users: Giving a comprehensive view of the portal’s reach and impact.

These metrics are crucial in identifying specific usability issues and guiding efforts to improve the student portal, ultimately enhancing the application experience for all prospective students.

Using the links from the flows above, the relevant analytics for each application flow were retrieved from the list.

Flow analytics

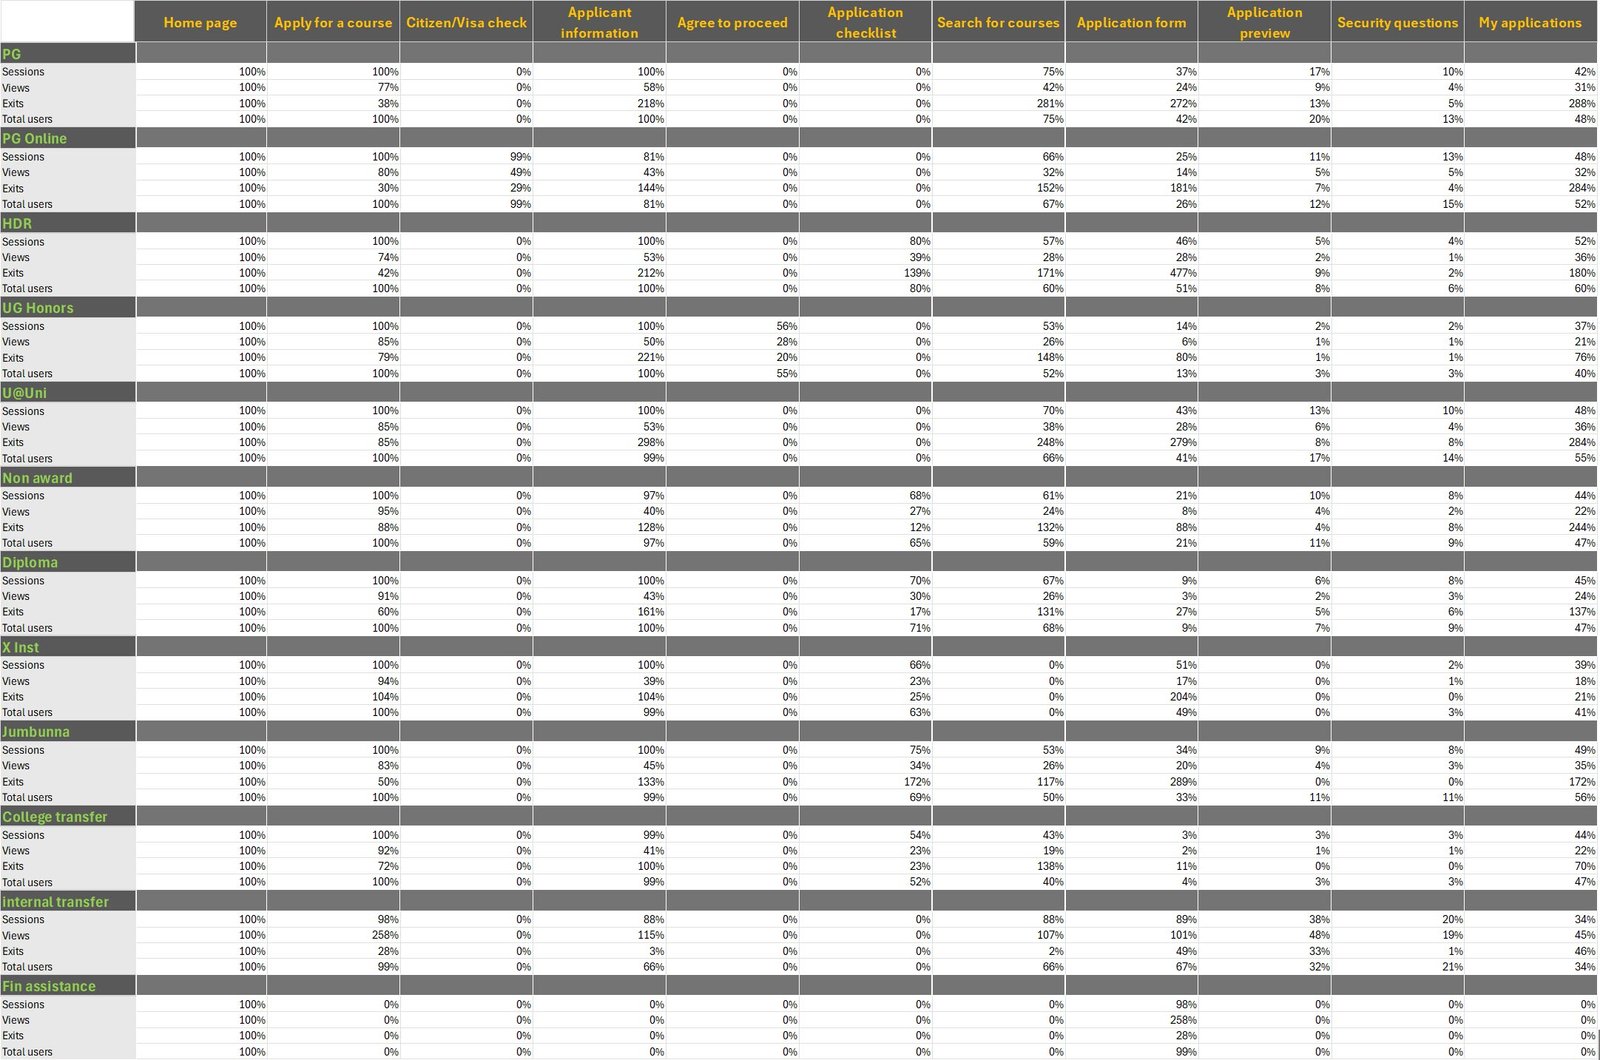
By baselining all analytics off the home page (column 1), and converting the averaged totals to percentages, we can start to build a picture of user engagement based on if the percentage is higher or lower than the first screen percentage of 100%.

These percentages provide a benchmark for understanding typical user engagement and exit points across the different pages. By analyzing these figures, we can better identify and address specific usability issues within the UTS student portal.

Here is the adjusted table with average totals of each analytics category:

Flow percentages

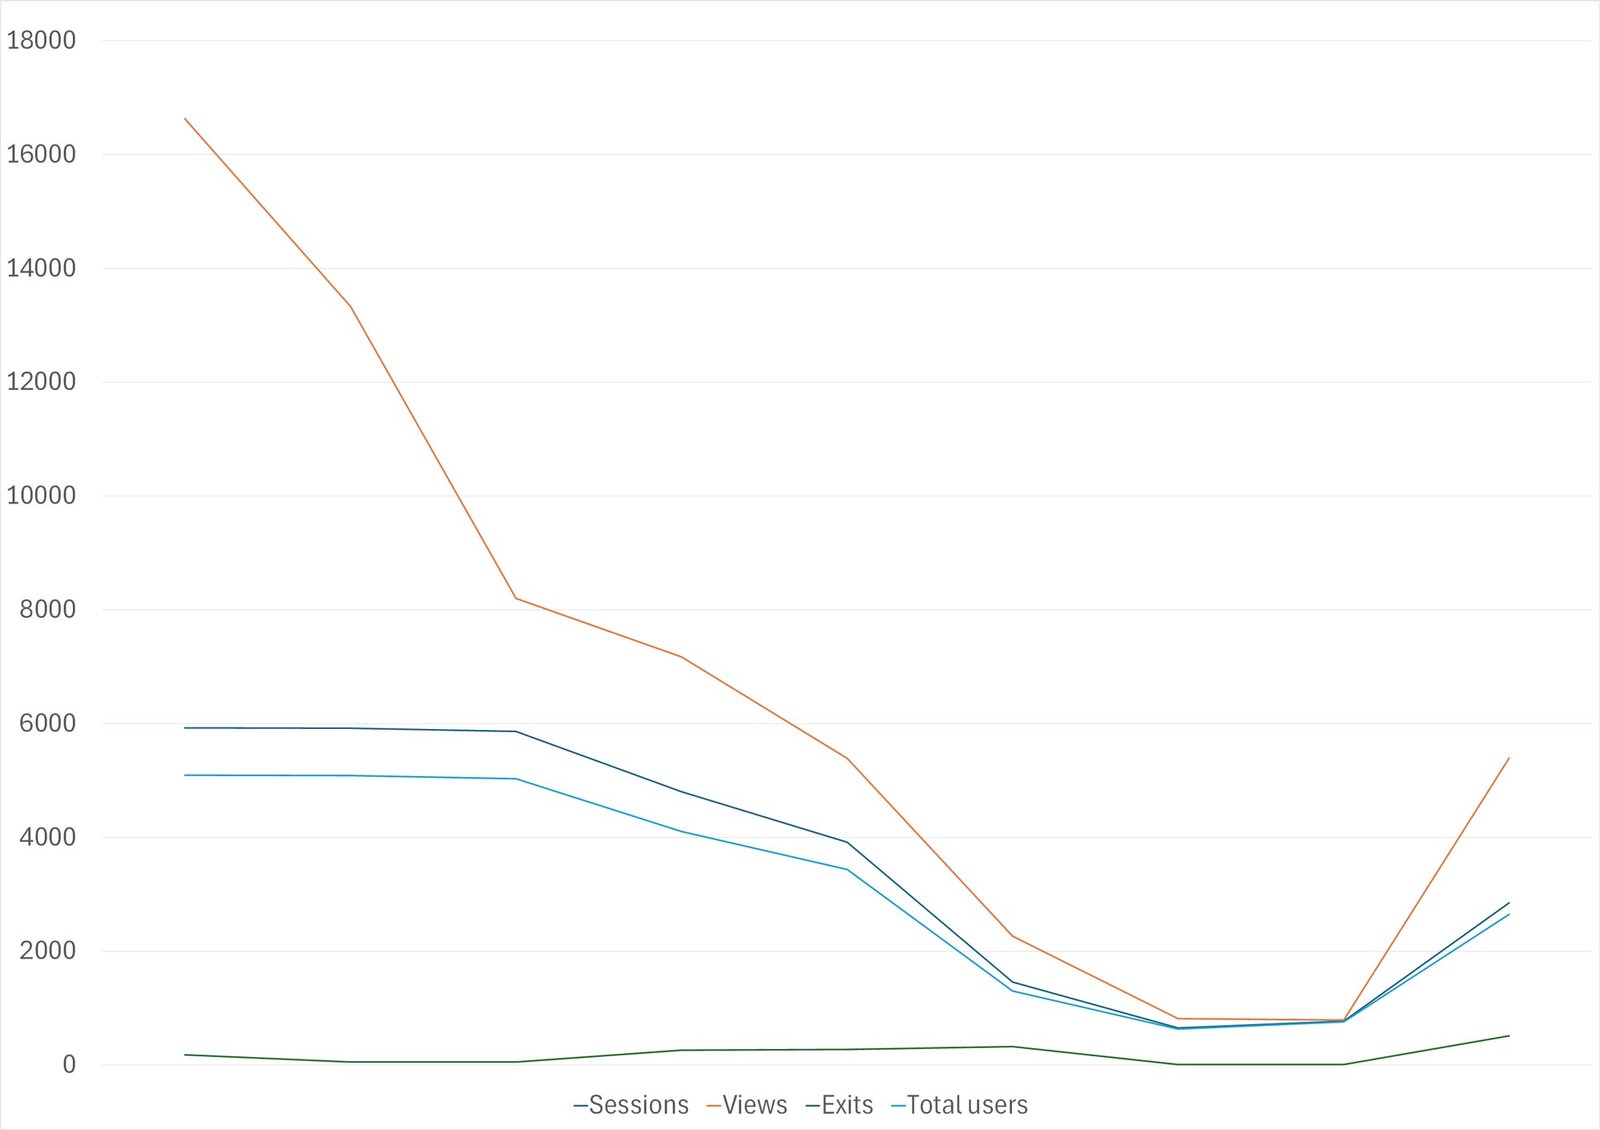
We can visualise the total sessions, views, exits and number of users using a chart.

By understanding each category of analytics (sessions, views, exists, total users) we can see which pages in the individual flows may be problematic in terms of usability, or at least worthy of investigation.

Below are the results of the application flows with the most numerous sessions.

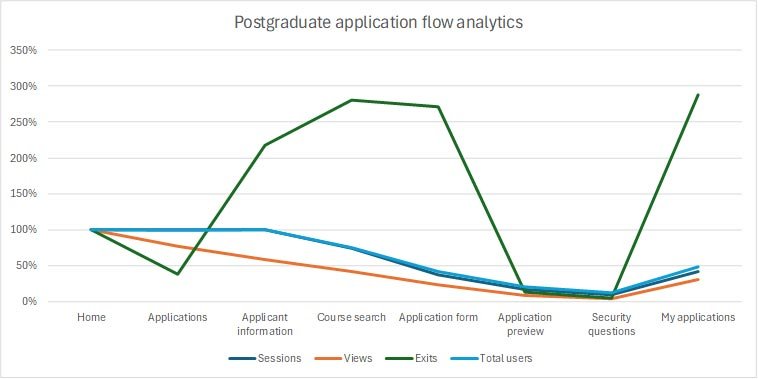
Postgraduate results chart
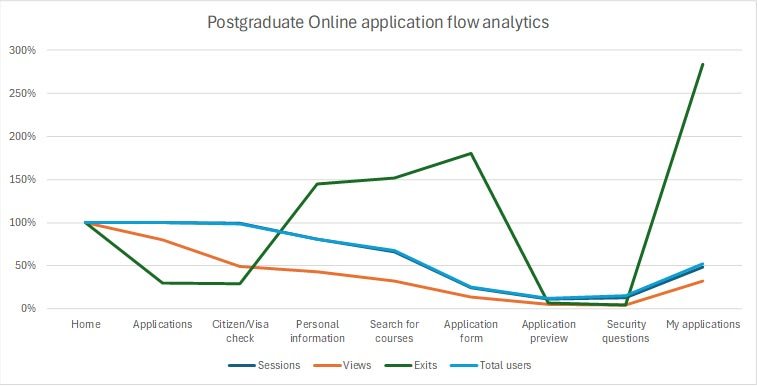
Postgraduate online results chart
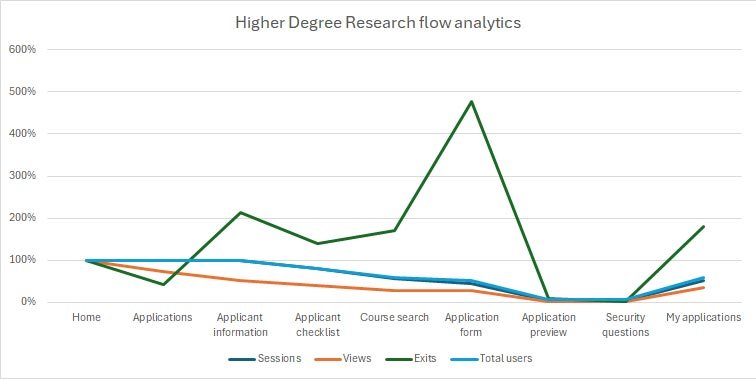
Higher Degree Research results chart

Looking at the charts above, we can see there may be significant issues with the application flows.

Exits (the green line) initially decrease to less than 50% on all flows.

Exits spike quite significantly (to almost 500%) on the application form screen in the HDR application flow. This spike in exits may be explained by the nature of the form itself, which is lengthy and has a number of requirements that may not be addressed on the first visit to the form.

In the case of the PG and PGO flows, exits spike on the applicant information, course search, and application form. There are known usability issues on these screens, particularly the course search screen, and more so on the application screen.

In conclusion, a review of the HDR application form should be conducted to reduce the requirement of users to exit the form, as well as address usability issues. The PG and PGO flows should also be reviewed, to identify unknown usability issues, and to correct the known issues.

In the case of all applications, consideration could be given to stream lining the flows and reducing the number of pages required to complete the flow, which is currently adding complexity to the experience.